Three scenarios to gauge the outlook
Market Insight
01/03/2024
We have been focused on three key data points to gauge the economic outlook. In particular, three indicators have been useful as indicators of recession. These are the manufacturing PMI, the Sahm rule, and the US Treasury yield curve. These data have improved recently. The three metrics continue to point to slowing or below trend growth. But the signal is less clear. When economic data become less clear, scenario analysis can be useful in gauging the outlook. We adopt three scenarios to help analyse the outlook for the economy and for markets.
The data have improved.
All three key indicators have moved further away from the level that indicates imminent recession. That suggests the economy could remain in an extended cycle for some time.
Chart 1: The manufacturing PMI has rebounded closer to 50. 45 indicates recession.
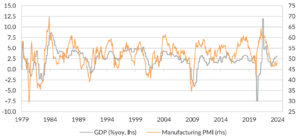
Source: Bloomberg LP, Oreana.
Chart 2: The Sahm rule has moved further away from the 0.5% that indicates recession.
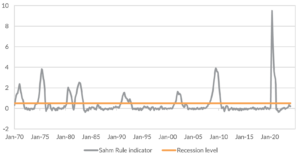
Source: Bloomberg LP, Oreana.
Chart 3: The yield curve has flattened (inverted further). Normalisation suggests imminent recession.

Source: Bloomberg LP, Oreana.
Scenarios help assess the outlook.
We have built 3 separate scenarios – Recession, Extended Cycle, and Productivity Boom, to help assess market pricing relative to the scenarios. We think Recession and Extended Cycle are more likely.
Table 1: Scenario analysis for 2024
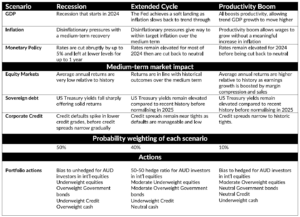
We have used these scenarios to assess the attractiveness of equities and government bonds. In all three scenarios, high quality government bonds remain attractive or neutral. High starting yields and the prospect for aggressive rate cuts in recession, and moderate rate cuts in extended cycle, deliver a high expected Sharpe ratio.
Equities are moderately unattractive in both the recession and extended cycle scenario. In recession, stretched starting valuations reprice aggressively, delivering low expected returns. But in the extended cycle, moderating growth is not sufficient to deliver earnings growth at fast enough pace to justify the starting valuations. Returns are still somewhat weaker than long-run averages.
Chart 4: Expected Sharpe ratios are moderately unattractive for US equities even in an Extended Cycle scenario.
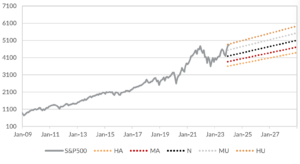
Source: Bloomberg LP, Oreana
Critically, this suggests that current US and Australian equity prices are reflecting a reacceleration of growth, only justifiable through the productivity boom scenario. This productivity boom could be driven by Al, for example – and that is what we think markets are rapidly extrapolating in current prices. The risk of disappointment remains high, particularly if material productivity gains are not delivered soon.
The USD rally through the start of 2024 has taken the AUD to below USD0.65. While there is further potential downside, the risk is somewhat less asymmetrically skewed. Our current hedge ratios are tilted towards being underhedged – which has benefited year to date, but leaves some risk of unwinding if the cycle extends.
A high hurdle for current valuations
In summary, we think scenarios are helpful in guiding portfolio decisions. Current market pricing is discounting not just an extended cycle or soft landing, but a genuine reacceleration of growth. There is some scope for that to be driven by meaningful productivity gains as a result of Al developments. But the risk of disappointment remains high, particularly if growth slows back to or below trend. As the economy data are somewhat mixed, we continue to monitor our key economic signposts including the manufacturing PMI, the change in the unemployment rate and the yield curve for guidance on which of these three scenarios is most likely.