What could financial repression mean for the market outlook?
Market Insight
20/08/2025
Key messages:
- Inflation has started to rise, while policy rates look likely to be cut. There is a risk rates fall below inflation as they did in the post-GFC period.
- Yields falling below inflation could be a positive for equities, but valuations remain elevated and risks remain skewed to the downside for earnings growth.
- We continue to be cautious on US equities, and recommend careful diversification for investors.
What is financial repression?
Financial repression occurs when interest rates are artificially low – particularly when rates are below the rate of inflation. This makes it easier and cheaper for governments to finance their debt. Over time, this reduces the real value of government debt at the expense of private savers, pensioners and debt investors.
In the US, the most obvious example of financial repression was in the postwar period, where real returns were negative for US government bonds. Another, less obvious example was the post-GFC period, where shorter-dated yields were substantially below the rate of inflation.
Chart 1: Shorter-dated yields were mostly below inflation in the US between 2008 and 2023.
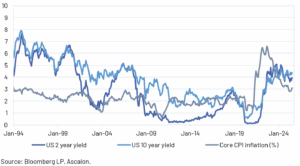
In 2024, after the Fed’s rate hike cycle, government bond yields have moved to be back above the rate of inflation. But tariffs are clearly having an impact on inflation, and inflation expectations are starting to move higher.
How much higher could inflation move?
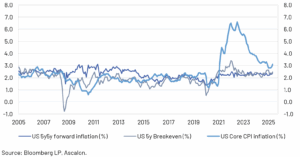
Core CPI inflation has started to clearly trend higher since its trough in H1 2025. Goods inflation is likely to reaccelerate as tariffs continue to impact prices. And services prices have started to re-accelerate, according to the most recent CPI data and the services PMIs. While it is early days, inflation breakevens – a measure of inflation expectations – have started to drift higher as well.
While tariffs may represent a one-off price hike in theory, the staggered approach to implementing the tariffs means prices could continue to grind higher over 2025 and into 2026. We suspect that core CPI inflation could reach as high as 4.0% from 3.1% currently.
Chart 2: Core CPI inflation and inflation expectations have started to trend higher in the wake of tariffs.
How much lower could US Treasury yields move?
US Treasury yields have trended lower through 2025, even as inflation has started to rebound. The US 2-year Treasury yield has declined more than 0.50% to 4.23%, while the 10-year yield has more than 0.30% lower to 4.23%.
Chart 3: US Treasury yields are trending lower.
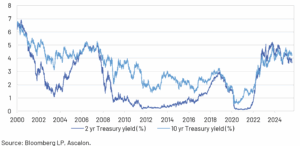
Despite core inflation moving higher, markets have moved to fully price a 0.25% rate cut at the Fed’s September meeting. More than 1% of rate cuts are priced by June in 2026. While we think the September rate cut is less likely than markets are pricing, we agree with both the direction and magnitude of rate cuts over the next 12 months. For Treasury yields, that could result in around a 1.0% move lower in 2-year yields, with roughly half of that in the 10-year yield.
The US is trending back to financial repression.
A trend towards financial repression is a feature, not a bug, of President Trump’s administration. Tariffs are inflationary, a weaker dollar adds to inflation pressures, and the Trump administration has been extremely vocal in its desire to see yields move substantially lower.
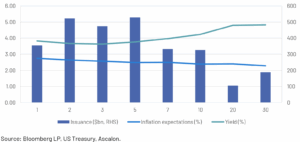
Chart 4 below shows the real expected cost of US Treasury debt – the difference between the yield and inflation expectations – is narrowest at shorter maturities. Unsurprisingly, the US Treasury is focusing its issuance at those maturities. And if yields move lower, while inflation moves higher, I expect we will see yields below inflation.
Chart 4: Issuance is focused on maturities where the gap between yield and inflation is narrowest.
Elevated valuations and slowing earnings growth are near-term risks, but repression is good for equities.
US equities have moved to record highs as markets have priced deeper rate cuts. But those prices have pushed valuations to levels that appear disconnected from slowing earnings growth, a weakening labour market, and a consumer wallet that is already stretched from cumulative impacts of recent inflation.
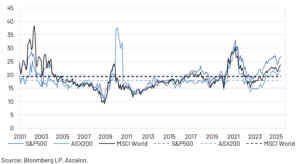
Chart 5: US equity valuations are stretched relative to history.
Given these pressures, we continue to view US equities with caution. Valuations are at levels that are consistent with weaker forward-looking returns. And the significant gains that US equities have enjoyed over the past 3 years add to our caution.
But financial repression is good for equities. So while risks abound in the medium-term, we are carefully monitoring bond markets for a return to negative real yields and financial repression, which could force investors out the risk curve and even more heavily into growth equities.
What can investors do to manage risks?
We think risks are skewed towards lower returns for equity investors, especially compared to the c.15% average annual returns equity investors have enjoyed over the past three to five years. And we see greater risk of market volatility. This does not mean that we expect deep drawdowns in equities. But it does suggest some caution in chasing rallies, especially when prices are at or near record highs.
For investors, we suggest building some downside resilience into multi-asset portfolios will be important. This could involve holding an underweight position in US equities, but more critically, we continue to suggest holding diversified exposures across geographies, sectors and asset classes as the best way to deal with this volatility.
Disclaimer: This presentation has been prepared by Oreana Private Wealth, a division of Oreana Financial Services(Oreana) for general information purposes only, without taking into account any potential investors’ personal objectives, financial situation or needs. This information consists of forward-looking statements which are subject to known and unknown risks, uncertainties and other important factors that could cause the actual results, performance or achievements to be materially different from those expressed or implied. Past performance is not a reliable indicator of future performance. Neither this document nor any of its contents may be used for any purpose without the prior consent of Oreana. Anyone reading this report must obtain and rely upon their own independent advice and inquiries.
Limitation of liability: Whilst all care has been taken in preparation of this report, to the maximum extent permitted by law, Oreana will not be liable in any way for any loss or damage suffered by you through use or reliance on this information. Oreana’s liability for negligence, breach of contract or contravention of any law, which cannot be lawfully excluded, is limited, at Oreana’s option and to the maximum extent permitted by law, to resupplying this information or any part of it to you, or to paying for the resupply of this information or any part of it to you.