What you should do if we don’t get a soft landing
Market Insight
01/08/2024
The market narrative is again coalescing around a soft landing for the US economy. The Fed has broadcast that it will begin cutting rates this year. Possibly as soon as September. Parallels are being drawn to the 1995 soft landing when the Fed cut rates three times to prevent a softening economy becoming something more painful. But the US economy is already slowing and the risk is that the Fed will cut too little, too late. Investors can hope for the soft landing, but should prepare for the risk that growth weakens materially in the medium-term.
What does a soft landing look like?
In early 1994, the economy was near its third year of recovery after the 1990-91 recession. By Feb 1994, the unemployment rate was declining rapidly, down from 7.8% to 6.6%. CPI inflation was at 2.8%, and the federal funds rate around 3%. The Fed grew concerned about a potential pick-up of inflation and increased rates pre-emptively seven times, from 3% to 6%. Restrictive rates caused some softening in the economy. The Fed responded by cutting the federal funds rate three times in 1995 when it saw the economy softening. Fed Chair Alan Greenspan took a bow. The soft landing was achieved.
How does 1995 compare to recessions?
We’ve been watching three key indicators for clues on the outlook – the unemployment rate, the yield curve and the manufacturing PMI. I’ve compared the 1995 soft landing to two recent recessions (2001 and 2007), and the current economic climate across these indicators. The key differences between the 1995 soft landing, the more painful episodes and now are discussed below.
1) Unemployment: In the 1995 soft landing, the unemployment rate was high and trending lower as the economy recovered from the 1990-91 recession. In 1995, the unemployment rate jumped higher in April before continuing to trend lower before the Fed cut rates in July. This is very different to the experience in 2001 and 2007, when the unemployment rate was low and trending higher prior to the Fed cutting rates. Right now, the unemployment rate looks more like 2001 than it does 1995.
Chart 1: The unemployment rate is trending higher.
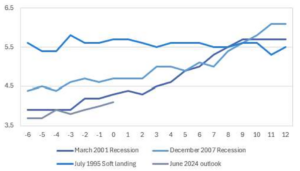
Source: Bloomberg LP, Ascalon Capital.
2) Yield curve: In both the 2001 and 2007 recessions, the US 2yr-10yr yield curve inverted prior to the recession. In 1995, the curve remained positive through 1994 and 1995 and in fact did not invert until prior to the 2001 recession years later. As of July 2024, the yield curve has been inverted for two years.
Chart 2: The US yield curve is deeply negative.

Source: Bloomberg LP, Ascalon Capital.
3) Manufacturing PMI: In the 2001 recession, the PMI fell below the 45 level that confirms recession prior to the recession beginning. In 2007, the PMI didn’t fall below 45 until around 12 months after the NBER had called a recession. But it fell much more sharply reflecting the depth of the Great Recession. In contrast, the PMI never fell below 45 in the soft landing. Right now, the PMI has been in the below trend growth range (45-50) for 19 of the past 20 months, but has not yet moved into recessionary territory.
Chart 3: The manufacturing PMI has not yet confirmed a recessionary outlook.
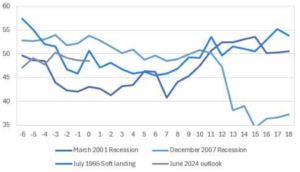
Source: Bloomberg LP, Ascalon Capital.
Equity markets are pricing a reacceleration of growth.
US equity markets are at or near record highs. Valuations look stretched by most metrics. It looks like markets are pricing in an immediate improvement in earnings growth to help justify valuations. But that will be challenging given the economy.
Rates are restrictive. The unemployment rate is trending higher. It is not clear that we will get a recession looking at the comparisons above. But growth is at best at trend and likely to slow to below in H2 2024. Even if we get a “soft landing”, it is unlikely to be accompanied by growth reaccelerating in the near-term.
This is important because a soft landing is more likely to be characterised by reduced pricing power by most companies, as sales growth moderates further. Profit margins are likely to contract.
Chart 4: Profit margins have likely peaked and could move lower in the near-term.

Source: Bloomberg LP, Ascalon Capital.
The combination will be some slowing in earnings growth. And that is going to be a challenge for record high equity prices to digest.
How can diversified portfolios manage the risks?
Rate cuts are coming from the Fed, and the clear hope is that those cuts will immediately provide a boost to growth. I think rate cuts will come too late. Monetary policy works with a lag – both when policy is tightened and when it is eased. The full impact of the Fed’s hikes are yet to work through the economy. The Fed’s cuts will similarly take time. The reality is that we are late cycle, and we don’t need a recession to justify an equity pullback. Just a realignment of earnings growth expectations.
I think having a modest underweight to international and Australian equities makes sense. It may be that if we do achieve a soft landing, the pullback will be shallow. For investors that genuinely believe in the soft landing, it may make sense to retain a full allocation to equities but adding some exposure to quality and value could provide some resilience.
In fixed income, credit has performed well recently. Lower quality credit has done particularly well. But there are signs of cracks appearing in the lowest quality and spreads are incredibly tight. A move up in quality including adding US Treasuries makes sense. Even for investors who are wedded to the soft landing narrative, I think moving to investment grade and reducing spread duration makes sense.
In short, it is prudent to be cautious. Investors that piled into risk in late 2022 have been rewarded – both in equities and fixed income. Now is the time to lock in some gains and build resilience in the portfolio.